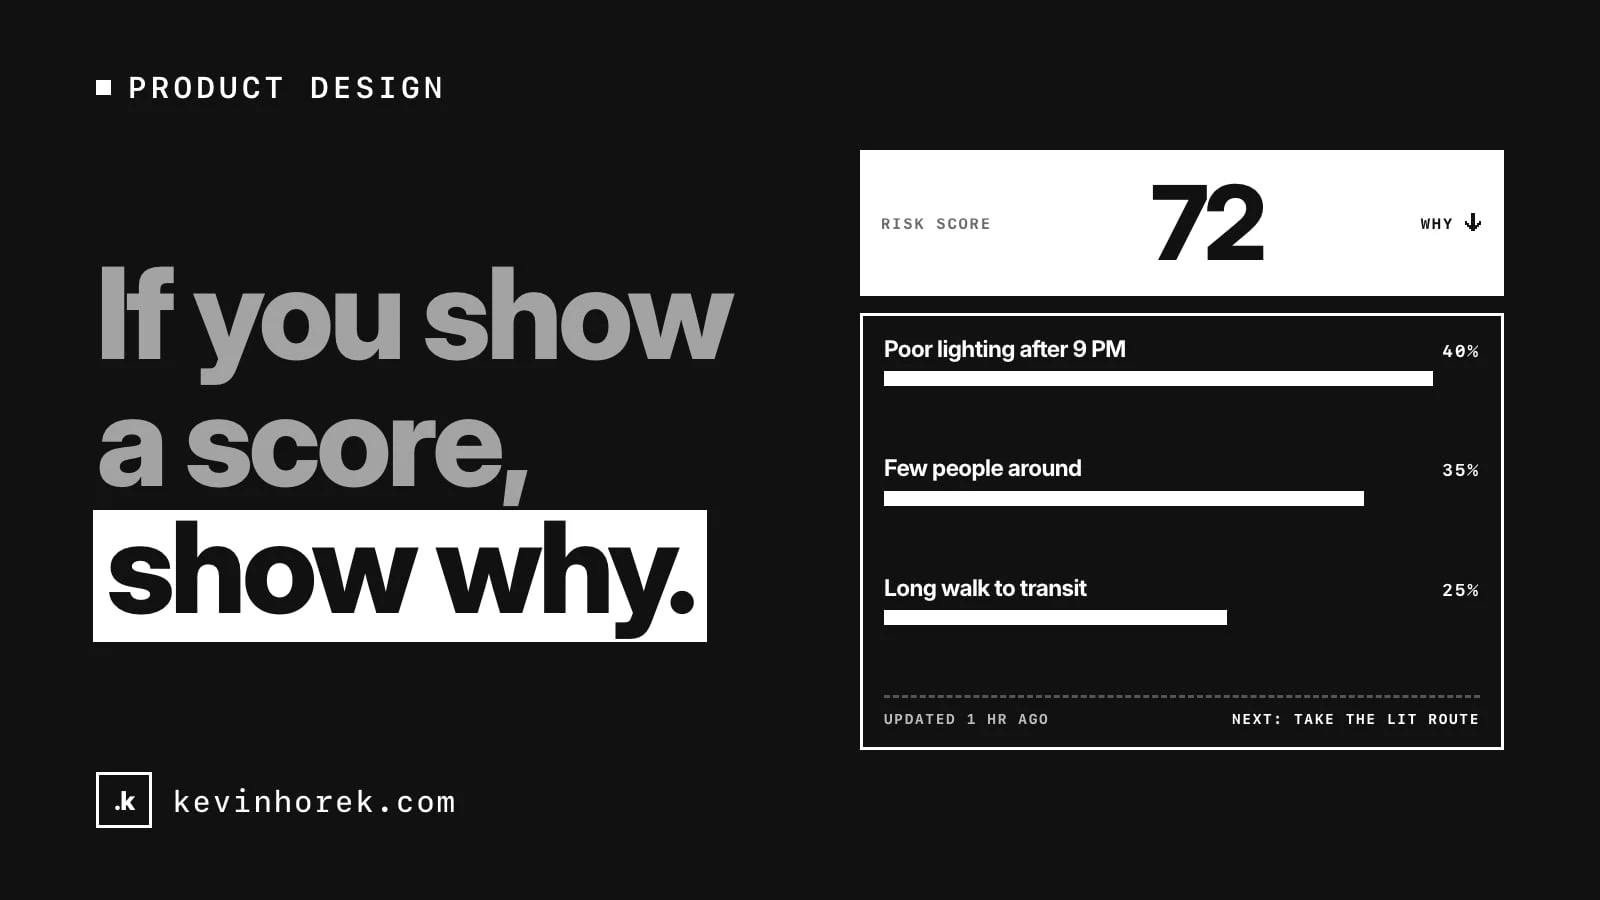
If your product shows a number that people act on, put the reasons behind it one tap away. Not in a help article. Not in a tooltip nobody finds. Right next to the number.
Scores are everywhere in software now. Risk scores, lead scores, credit-style ratings, account health, fraud flags, AI confidence. They are popular because they compress a lot of information into something you can read in a second.
That compression is also the problem. A number on its own asks people to trust it. A number with its reasons lets them check it.
A score without reasons gets ignored or obeyed
I have seen two things happen when a product shows a bare score.
Some people ignore it. They do not know where it came from, so they go back to their own judgment and the feature becomes decoration.
Other people obey it. They act on the number without asking whether it fits the case in front of them. That is worse, because now the score is making decisions nobody can explain.
Neither is what you wanted. You wanted people to use the score as a starting point and bring their own knowledge to it. They can only do that if they can see what went in.
What "show why" means in practice
Showing why does not mean publishing your model. It means answering the three questions a person has when they see the number:
- What pushed it up or down? The main factors, in plain words, with how much each one counted.
- Is it current? When the data behind it was last updated, and what would change it.
- What can I do about it? The action that follows from the score, or the thing that would move it.
If a person can answer those three in a few seconds, they can decide whether to trust the score for this case.
How I tried it in a prototype
I built a rough prototype called the CrimsonRadar Live Risk Globe to test this idea in a consumer setting. It is a 3D globe of made-up areas that shows how safe each one feels right now. Every place and every score is invented.
Each area has a score, and next to it a "Why this score?" button. Tap it and you see four factors: crime, weather, crowds and lighting. Each one shows its own rating and how much of the overall score it makes up. A short note explains that the mode you picked, Traveller, Night out or Student, weights those factors differently.
That last part turned out to matter. Switch from Traveller to Night out and the whole globe changes colour. Without the breakdown, that looks like the data changed. With it, you can see that the data is the same and the weighting moved. Lighting counts for more at night.
Try the demo. It runs on made-up data, and it is a prototype, not a safety service.
Put the reasons where the decision happens
The most common mistake I see is putting the explanation somewhere else. A methodology page. A docs link. A modal three clicks deep.
People decide at the moment they see the number. That is where the reasons need to be.
A few patterns I use:
- One tap, not one page. Expand the breakdown in place, next to the score. Closing it should leave the person exactly where they were.
- Factors in the user's words. "Poor lighting after 9 PM" beats "illumination index 0.32". If you cannot explain a factor in plain language, ask whether it belongs in the score.
- Show the weights. People understand "this counts for 40% of the score" immediately. It also shows them which factor to look at first.
- Name the mode or settings. If the score depends on a filter, a profile or a time of day, say so beside the number.
- Show the date. A score from last month and a score from an hour ago are different things. Say which one this is.
Let people disagree with it
A person often knows something your data does not. The street was relit last week. The lead already signed with someone else. The account looks unhealthy because the customer is on holiday.
Give them a way to say so. In the globe prototype, every simulated trip ends with a short check-in: a rating, a few tags and notes. In a real product, that kind of feedback is how a score gets better over time.
In a business tool it might be a "this looks wrong" button that asks for one line of reason. Read those every week. They tell you which factors are missing or overweighted faster than any analysis you will run.
When a score is the wrong design
Sometimes the honest answer is that a single number hides too much. If two factors pull hard in opposite directions, an average can look calm while one of them is alarming.
In those cases I would rather show two or three separate ratings than one blended score. The globe's route planner does this: it compares a fastest and a safest route, each with its own time, risk, lighting, crowd and incident ratings, instead of one route quality number. People can make the trade-off themselves.
Ask yourself what the person will do with the number. If the decision depends on which factor is bad, show the factors, not the blend.
AI makes this more important, not less
More products now put an AI-generated rating or recommendation in front of people. A model's output can feel authoritative even when it is guessing.
The same rule applies. Show what the rating is based on, how recent that is and what the person can do. If the model cannot give reasons you can check, be careful about presenting its output as a score at all. I wrote more about that kind of design choice in agent tools are user experience.
A short checklist
Before you ship a score, check that:
- The top factors are visible in one tap, in plain words.
- Each factor shows how much it counts.
- Any setting that changes the weighting is named next to the number.
- The date of the data is shown.
- There is a clear next action.
- People can say when they think it is wrong, and someone reads those reports.
A number people cannot question is a number they will either ignore or follow blindly.
How do you explain the scores and ratings in your product today? I would like to hear what has worked and what people still misread. If you want to compare notes, email me.
#ProductDesign #UX #Trust #Data