A lot of companies sit on data other people would find useful. An industry association surveys its members every year. A software company holds anonymised metrics from its customers. A consulting team has years of results from the same kind of project.
The usual way to share it is a benchmark report. Someone pulls the numbers, a designer lays out charts, and a PDF goes out with a landing page and an email.
People read it once, if they read it at all. They skim the headline numbers. Then the same question stops most of them: does this apply to a company like mine?
A PDF cannot answer that. An interactive report can.
Start with the reader's question
The reader of a benchmark report wants to know two things. What is normal for companies like mine? And where do I stand?
A static report answers neither well. It shows everyone, averaged together. A small company and a large one get the same chart. The reader has to guess how much of it applies.
So design the report around those two questions, not around the charts you already have. Every section should help a reader find their peers and compare themselves with them.
Let readers filter to their peers
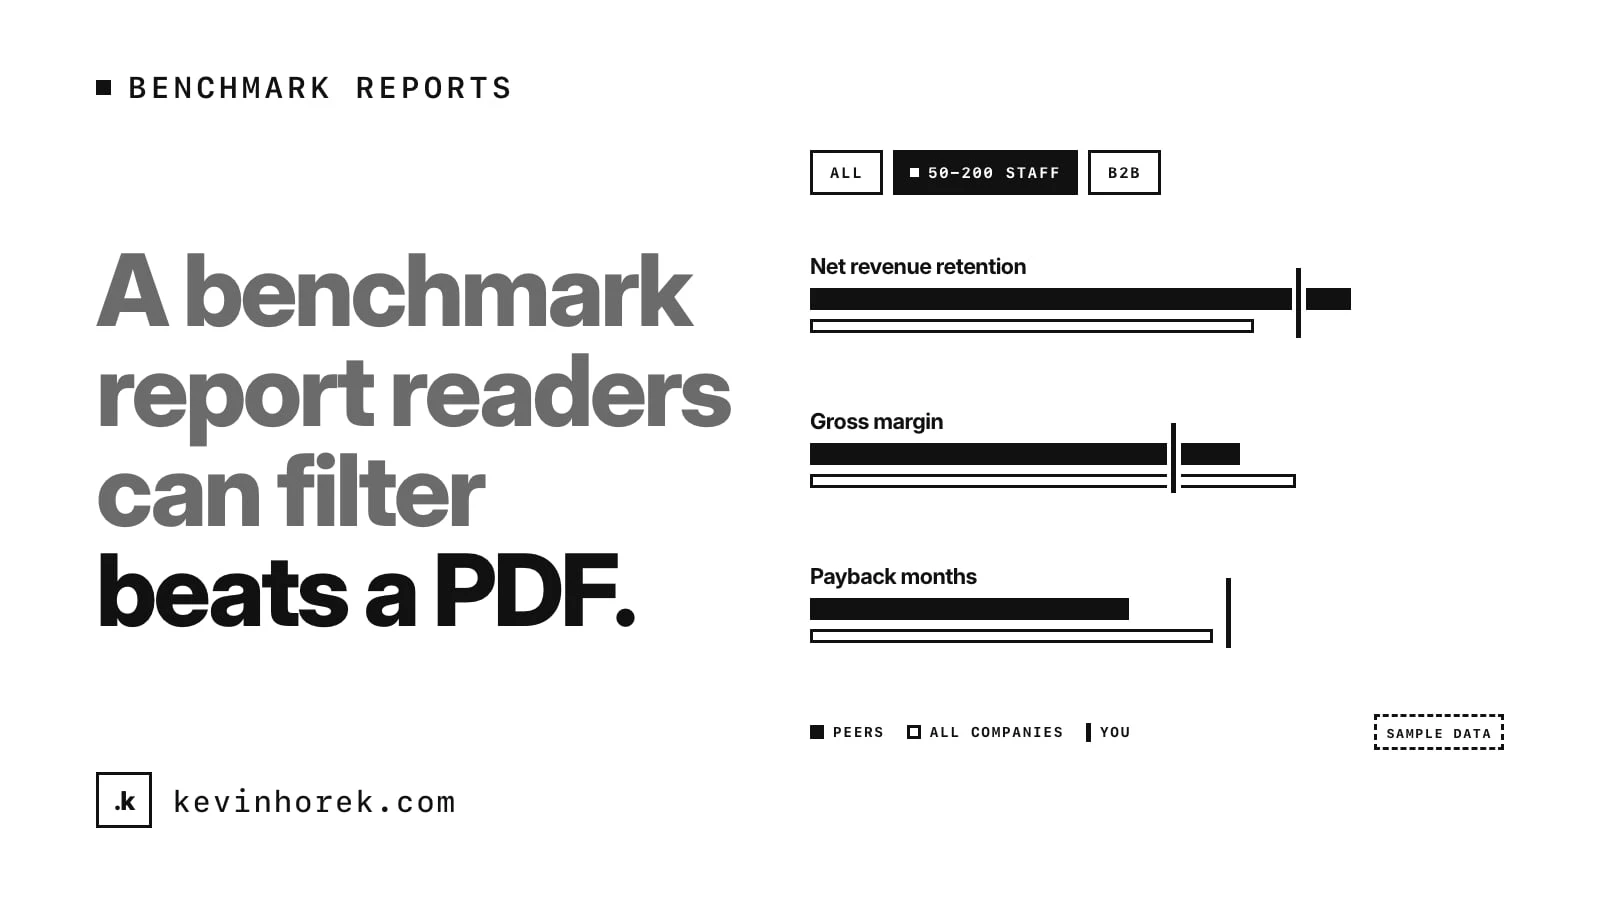
The most useful thing you can add is a set of filters for the ways companies differ: size, type of customer, business model, region if it matters. Pick the few that change the numbers most. Four good filters beat twelve.
When a reader picks a filter, everything on the page should update: the charts, the key numbers and the sentences that describe them. If the text still says "most companies" while the chart now shows only small ones, readers stop trusting both.
Two details make filters work:
- Always show the comparison. When a filter is on, show the whole sample alongside the slice, as a faint reference bar or a "vs. all companies" difference. A number means more next to its baseline.
- Warn when a slice gets small. If a filter leaves only a handful of companies, say so clearly. A median from a tiny group can look just as solid on a chart as one from hundreds.
Keep the chosen filters in the page address, so a reader can send a colleague the exact view they were looking at. That is how a report gets shared inside a company.
Show the spread, not just the average
Averages hide most of what readers care about. If the median is one number but the top quarter is far ahead, that gap is the story.
For each metric, show where the middle half sits, the median and what the best performers achieve. A simple distribution chart does this better than a single bar. Readers can see at a glance whether a result is ordinary or unusual.
Let readers score themselves
This is the part people come back for. Give readers a way to enter their own numbers, one metric at a time, and show where they would rank against the current slice: their percentile, the peer median and the metric where they are furthest behind.
Two rules for this part. Do it in the browser, and say clearly that nothing is saved or sent. Readers will hesitate to enter real numbers if they think you are collecting them. And keep the result plain: a rank and one sentence on where to look first is more useful than a score nobody can explain.
Label sample and made-up data clearly
This matters more than any chart.
If any of the data is a sample, synthetic or illustrative, say so where people will see it: on the cover, near the filters and in the footer. Not in a footnote on page 30. A screenshot of one chart will travel without the rest of the report, so the label should be close to the numbers.
The same goes for real data. Say how many companies are in the sample, how they were chosen and when the data was collected. Say what the data cannot tell you. Readers forgive a small sample. They do not forgive finding out later that a chart they quoted was not what it looked like.
If you are building a demo or a pitch with placeholder data, the label is not optional. Made-up numbers in a nice chart look exactly like research.
Make every chart readable
Interactive does not have to mean hard to use. A few basics:
- Label values on hover, and offer a table view for every chart.
- Keep a glossary for every metric, with a plain definition.
- Make the page work on a phone, with the filters tucked into a bar that opens.
- Handle empty results. If no company matches a filter, say so instead of drawing a blank chart.
The table view helps people who use screen readers, and it helps anyone who wants to copy a number into their own slides.
Why it brings readers back
A PDF is finished the day it ships. An interactive report is a tool. A reader can return when their numbers change, when a colleague asks a question, or when they are preparing for a board meeting. Each visit is a reason to remember who published it.
It also tells you what readers care about. Which filters people use, and which metrics they open, is useful feedback for next year's survey. If you plan to watch that, tell readers in plain terms what you track.
A benchmark is only useful when readers can find companies like theirs, see where they stand and trust what the numbers are.
Try it
I built a rough prototype of this idea, Benchmark Studio, an interactive benchmark report for software billing. It has four filters that recalculate the whole page, a comparison with all companies, a metric explorer and a "benchmark yourself" tool. Every company and number in it is made up, and it says so on the cover, the filter bar and the footer. Try the demo. Please do not quote its numbers as findings.
If you are planning one, I also wrote about testing a product idea before building it, which applies to reports as much as apps.
A checklist for interactive benchmark reports
- Design around two questions: what is normal for companies like mine, and where do I stand?
- Add a few filters that matter, and update every chart and sentence.
- Always show the whole sample next to the slice, and warn when a slice is small.
- Show the spread, not just the average.
- Let readers score themselves in the browser, with nothing saved.
- Label sample or made-up data on the cover, the filters and the footer.
- Offer table views, a glossary and a phone layout.
How do you share benchmark data today? A PDF, a slide deck, or something people can explore?
If you are sitting on data you think others would use, email me and tell me how you share it now.
#Data #UX #ContentMarketing